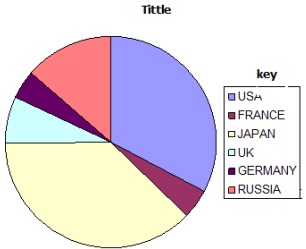
This is use of circles of various sizes to represent different sets of statistical data
Table showing mineral production In Kenya from year1998-2000

Steps
1. Determining the radii of circles by finding the square roots of the totals
1998 √1000 = 31.62 = 32
1999 √1915 = 43.76 = 44
2000 √3000 = 54.77 = 55
2. Scale:1cm represents 10 tonnes
1998 = 3.2 cm
1999 = 4.4 cm
2000 = 5.5 cm
3. Using a pair of compasses draw circles of different radii representing mineral production in Kenya
between 1998 and 2000.
4. Convert component values into degrees
Component value/ total value of data X 360
1998: Graphite - 200/1000 X 360 = 72°
Fluorspar - 30/1000 x 360 = 10.8°
Soda ash - 270/1000 x 360 = 97.2°
Diamond - 500/1000 x 360 = 180°
1999: Graphite - 490/1915 x 360=92.1°
Fluorspar - 255/1915 x 360 = 47.9°
300/1915 x 360 = 56.4°
Diamond-870/1915 x 360 = 163.6°
2000: Graphite - 930/3000 x 360 = 11.6°
Fluorspar - 450/3000 x 360 = 54°
Soda ash - 350/3000 x 360=42.1°
Diamond - 1270/3000 x 360=152.3°
5. On the proportional circle for each year use a protractor and mark out the angles
6. Shade the segments and then provide a key.
Advantages
1. They give a good visual impression.
2. Easy to compare various components.
3. Simple to construct.
4. Easy to interpret as segments are arranged in descending order.
5. Can be used to present varying types of data.
Disadvantages
1. Tedious in calculation and measurement of angles
2. Actual values represented by each component cant be known at a glance
3. Difficult to accurately measure and draw sectors whose values are too small.
4. Comparison can be difficult if the circles represent values which are almost equal.
Analysis/Conclusions
1. Diamond was leading in production.
2. The second leading mineral in production was graphite.
3. The mineral with the lowest production was fluorspar.


